Would BTC/USD Break Above $60,000?


Bitcoin Price Prediction – November 19
The Bitcoin price bounces above the support level of $55,625 as the coin adds more than $2000 to reach the current value.
BTC/USD Long-term Trend: Ranging (Daily Chart)
Key levels:
Resistance Levels: $66,000, $68,000, $70,000
Support Levels: $50,000, $48,000, $46,000
BTC/USD is currently trading around $57,000 with a 1.68% gain in the past 24-hour. According to the daily chart, the Bitcoin price is fighting to stay above the important level of $58,000 as it moves toward the 9-day and 21-day moving averages. However, for BTC/USD to remain above this barrier for the next few days, the bulls need to make the $55,000 support level to be pretty strong.
Bitcoin Price Prediction: Could Bitcoin Price Break Higher?
Since the past few days, the Bitcoin price has been experiencing a downtrend, and if the king coin breaks below the lower boundary of the channel, it could touch the nearest support level of $54,000. Moreover, Bitcoin (BTC) needs to reclaim this important resistance level to head upwards. If successful, the primary cryptocurrency could therefore aim at the $58,000 resistance level.
However, looking at the technical indicator Relative Strength Index (14), one may conclude that BTC/USD is likely to face more downsides. Meanwhile, on the upside, recovery may not come easy and traders must be aware that the market price must stay within the channel while other important zones to keep in mind are around $66,000, $68,000, and $70,000 resistance levels. In other words, any bearish movement below the channel may touch the supports at $50,000, $48,000, and $44,000.

BTC/USD Medium – Term Trend: Bearish (4H Chart)
On the 4-hour chart, the Bitcoin price remains at the downside as the technical indicator Relative Strength Index (14) keeps moving 40-level. Meanwhile, the coin may begin the upward movement as soon as the current market value crosses above the 21-day moving average.
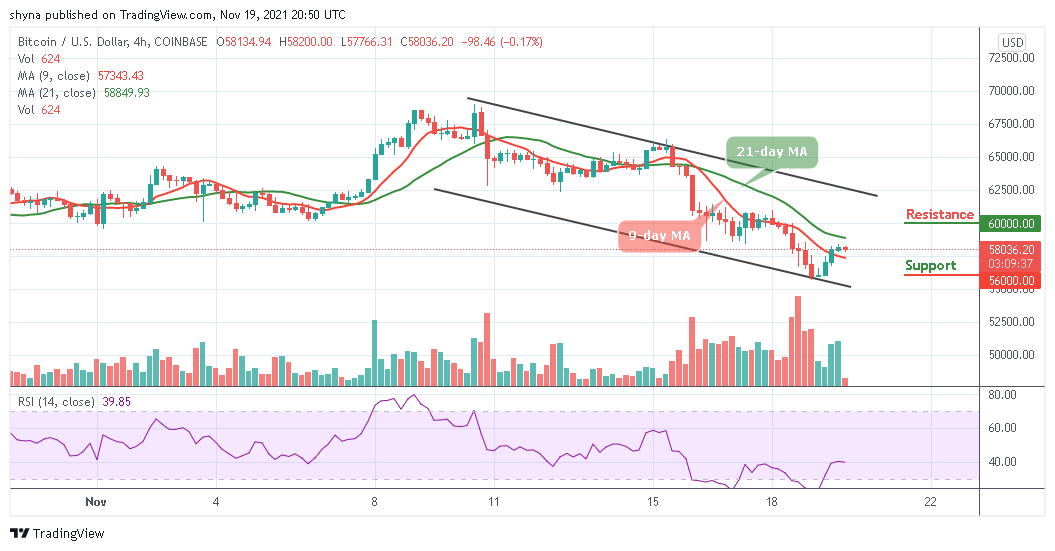
However, once this scenario plays out, the market price may likely reach the resistance at $60,000 and above. On the contrary, if the current market value drops below the 9-day moving average, it may likely touch the support at $56,000 and below.
Looking to buy or trade Bitcoin (BTC) now? Invest at eToro!
68% of retail investor accounts lose money when trading CFDs with this provider
Read more:


